
Business software and compliance Case study
GeeScore: job and jobseeker scoring platform

A web platform for GeeScore that connects jobseekers with jobs and scores how well they match, with job lists and details, a dashboard, graphs and maps, a customisable widget and Stripe payments, on AWS.

- Client
- GeeScore
- Service
- Web apps, Integrations
- Years
- 2018–2021 (3 years)
- Stack
- AWS Lambda, AWS, React, Node.js and 6 more
- Platforms
- Web
Overview
GeeScore is a platform that scores how suitable a jobseeker is for a job. Jobseekers keep a resume with degrees, skills and certifications, companies post jobs, and the platform parses the data and scores it. We worked on it from 2018 to 2021: the back-end data functions and AWS services, the dashboard, graphs and maps, a downloadable widget that other sites can embed, and the payment forms.
The challenge
The platform takes in resumes and job postings and has to turn them into scores people can read. Companies, jobseekers and embedding sites each need their own view of the same data.
What we built
- Back-end data functions and stored procedures for jobseekers, jobs and companies, including create, read, update and delete for job postings and resumes
- Node.js functions and AWS Lambda functions for the jobseeker module, and API integration on AWS
- Development and backend environments, and deployment of both
- A React dashboard with job lists and job details
- Graphs (Chart.js) and maps (Mapbox) with custom tooltips
- An embeddable, customisable widget with its own APIs, pages and animation, that shows a score per job with a breakdown by component
- Stripe subscription payment forms, with coupon pop-ups
- Pages and templates for the public site on WordPress, with pop-ups and responsive layouts
- Review of the existing code, merging of branches, and bug fixing and design fixes across the platform
Technology used
| Layer | Choice | Purpose |
|---|---|---|
| Cloud | AWS | development and backend environments |
| Front end | React, Redux Toolkit, Chart.js, Mapbox | dashboard, graphs, maps and the scoring widget |
| Back end | Node.js, AWS Lambda | jobseeker, job and company functions |
| Payments | Stripe | subscriptions and coupons |
| Public site | WordPress | pages, templates and pop-ups |
| Data | Database stored procedures | seekers, jobs and companies |
What happened next
- Delivered
The work described above was delivered to the client.
- Operational facts
- Our work on this project spanned 2018–2021.
- It was maintained and extended over 3 years.
Screens
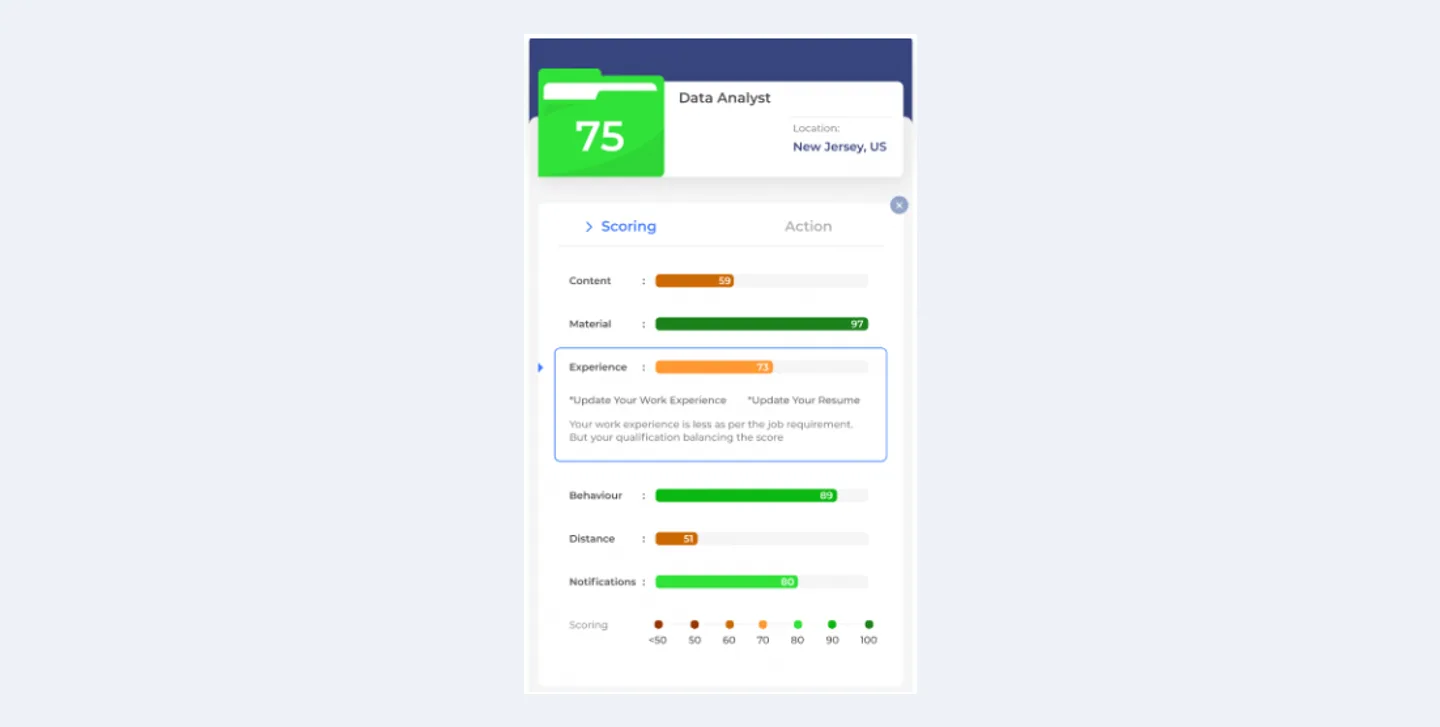
Could this be your project?
- You need a web application with user accounts, admin tools and reporting. Website and web app development
- Your product has to connect to payment, accounting, messaging or other third-party systems.
- You work in business software and compliance and want a team that has built for it before. Business software and compliance work
Questions about this project
How long did this project take?
Our work on it ran from 2018 to 2021.
What technology was used?
AWS Lambda, AWS, React, Node.js, Stripe, WordPress, REST APIs, Redux Toolkit, Chart.js, Mapbox.
Was it maintained and extended over time?
Yes. Our work on this project was maintained and extended over 3 years, from 2018 to 2021.
Similar work
Also AWS and React, same industry
Rackless: ticket and work-request platform
A long-running web platform for Rackless, a cloud software services company: a ticket and work-request app with reports and email notifications, plus its WordPress sites, a Salesforce integration and a React Native app.

Also AWS and content management systems, same industry
Top Tier Editing: quote calculator and order platform
A .NET Blazor quote calculator, order and checkout flow and back office for Top Tier Editing, an editing service: instant prices from admin-set rules, document upload with word count, Stripe and PayPal payments and scheduled emails.
Also React and Node.js, same industry
A React and Node.js portal for RiskA that connects to a customer's Microsoft tenant, reads its Secure Score and recommendations from Microsoft Graph, and turns them into an identity score, a 90-day trend and a fix checklist.